What Material Utilization Rate Should Your Cutting Shop Be Hitting?
Material utilization benchmarks for cutting shops: what rate is achievable, how to measure it yourself, and a diagnostic checklist when your yield falls short.
Every few weeks a shop operator messages me after discovering their material utilization was somewhere in the low 60s when they assumed it was around 80. The gap is almost never obvious from looking at finished parts. A sheet with 62% utilization looks identical to one with 88% from a distance. You only see the difference in your monthly sheet spend.
This post gives you the benchmarks by nesting method and part type, shows you how to calculate your own rate in under five minutes, and walks through the most common reasons a rate falls short of what it should be.
The short answer: what rate should you be hitting?
If you are using any nesting software with true-shape support and rotation enabled, 85–92% is achievable on typical fabrication jobs. If you are laying out parts manually or using basic rectangular nesting, expect 60–75% depending on part geometry.
Those are real operational ranges. A comprehensive guide published by ADH Machine Tool (October 2025) put it plainly: rectangular nesting delivers 60–70% utilization on typical jobs, while advanced true-shape nesting reaches 85–95%. The same guide documented one fabricator cutting sheet usage from 63 sheets down to 42 for a regular production run, a 33% direct reduction in material cost.
How to calculate your own rate
Material utilization rate is the fraction of each sheet that becomes finished parts rather than scrap.
Formula:
Utilization (%) = Total part area ÷ (Sheets used × Sheet area) × 100In practice:
- For a completed job, count how many sheets you used and note the sheet dimensions
- Sum the area of all individual parts (most DXF or design files report this; CAM software usually shows it too)
- Divide: part area ÷ (sheet count × sheet area)
Example: You cut 120 brackets, each with a part area of 280 cm². Sheet is 1500×3000mm (45,000 cm²). You used 4 sheets.
Utilization = (120 × 280) ÷ (4 × 45,000) = 33,600 ÷ 180,000 = 18.7%... That would mean 81.3% waste, which seems extreme. But that’s correct if you actually needed only 0.75 of a sheet to hold those parts at 90% nesting efficiency (120 × 280 = 33,600 cm², and 33,600 ÷ (0.9 × 45,000) = 0.83 sheets). So using 4 sheets is a significant overrun.
More useful framing: track utilization per nest, not per job. Calculate it as: part area on that specific sheet ÷ sheet area. Average across a week of nesting jobs for a representative baseline.
Benchmarks by nesting method and part type
The chart below shows material utilization rates across five nesting approaches and four part shape categories. The numbers come from my own calculations and are consistent with published industry benchmarks.
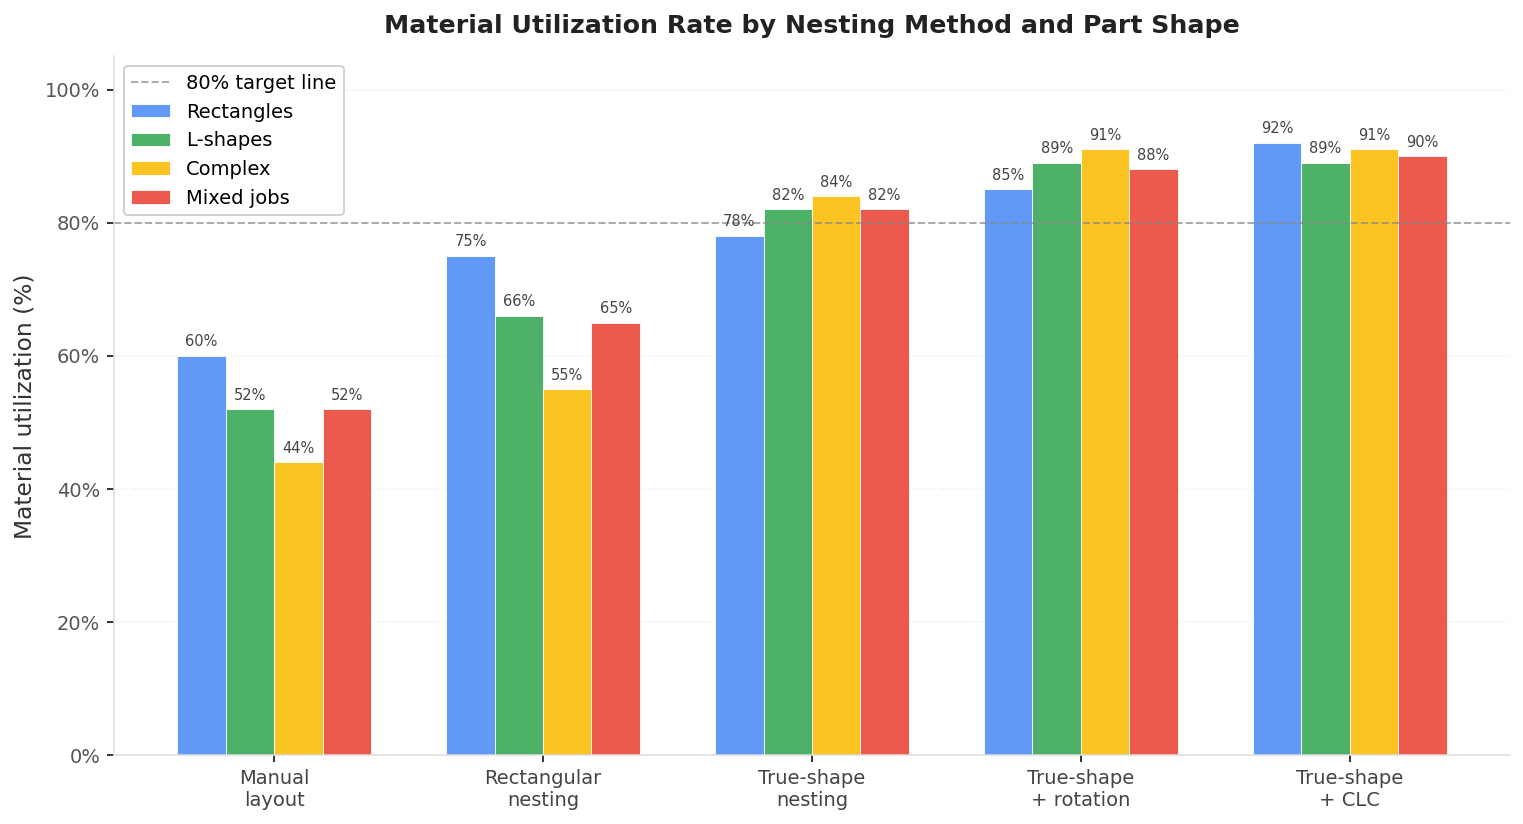
| Method | Rectangles | L-shapes | Complex | Mixed jobs |
|---|---|---|---|---|
| Manual layout | 60% | 52% | 44% | 52% |
| Rectangular nesting | 75% | 66% | 55% | 65% |
| True-shape nesting | 78% | 82% | 84% | 82% |
| True-shape + rotation | 85% | 89% | 91% | 88% |
| True-shape + CLC (rect. parts) | 92% | 89% | 91% | 90% |
A few things stand out here that many operators don’t expect.
Rectangular nesting actually performs worse on irregular parts than true-shape nesting does, by a wide margin. If you cut a lot of L-shapes, flanges, or irregular brackets and you’re using rectangular nesting, you’re likely in the 55–65% range even though your parts aren’t that complex.
Complex irregular parts nest better under true-shape than simple rectangles do, because the algorithm can interlock concave and convex edges in ways that rectangular nesting structurally cannot. Two rectangles sit next to each other with a gap. Two complex brackets can be partially interlocked with almost no gap between them.
Enabling part rotation is one of the highest-value changes in nesting settings, adding 5–10 percentage points on most jobs. Part rotation nesting software covers the trade-offs in detail, including when to disable rotation for grain direction compliance.
For a controlled head-to-head rather than ranges, our Lapas vs Deepnest nesting benchmark runs both engines on the same parts, plates, and time budgets, then scores the density from the output geometry with an independent program. On the academic ESICUP instances Lapas nests roughly 13 percentage points denser, and on the real sheet-metal jobs it fits the same parts on fewer sheets.
A concrete cost example
To show the financial stakes, here’s one job calculated across four nesting methods. The job is 800 steel flanges, each 20×30cm, cut from 1500×3000mm sheets of 3mm mild steel at $85/sheet.
| Nesting method | Utilization | Sheets needed | Material cost | vs. manual |
|---|---|---|---|---|
| Manual layout | 62% | 18 | $1,530 | - |
| Rectangular nesting | 72% | 15 | $1,275 | -$255 |
| True-shape nesting | 83% | 13 | $1,105 | -$425 |
| True-shape + rotation | 91% | 12 | $1,020 | -$510 |
For one job this is $510. Across a year of production at a small shop (8 sheets/week), the difference between rectangular and optimized true-shape nesting adds up to roughly $4,400 in raw material savings. At 30 sheets/week, that number reaches $26,500. The material waste cost calculator walks through how to run this calculation for your specific sheet cost and volume.
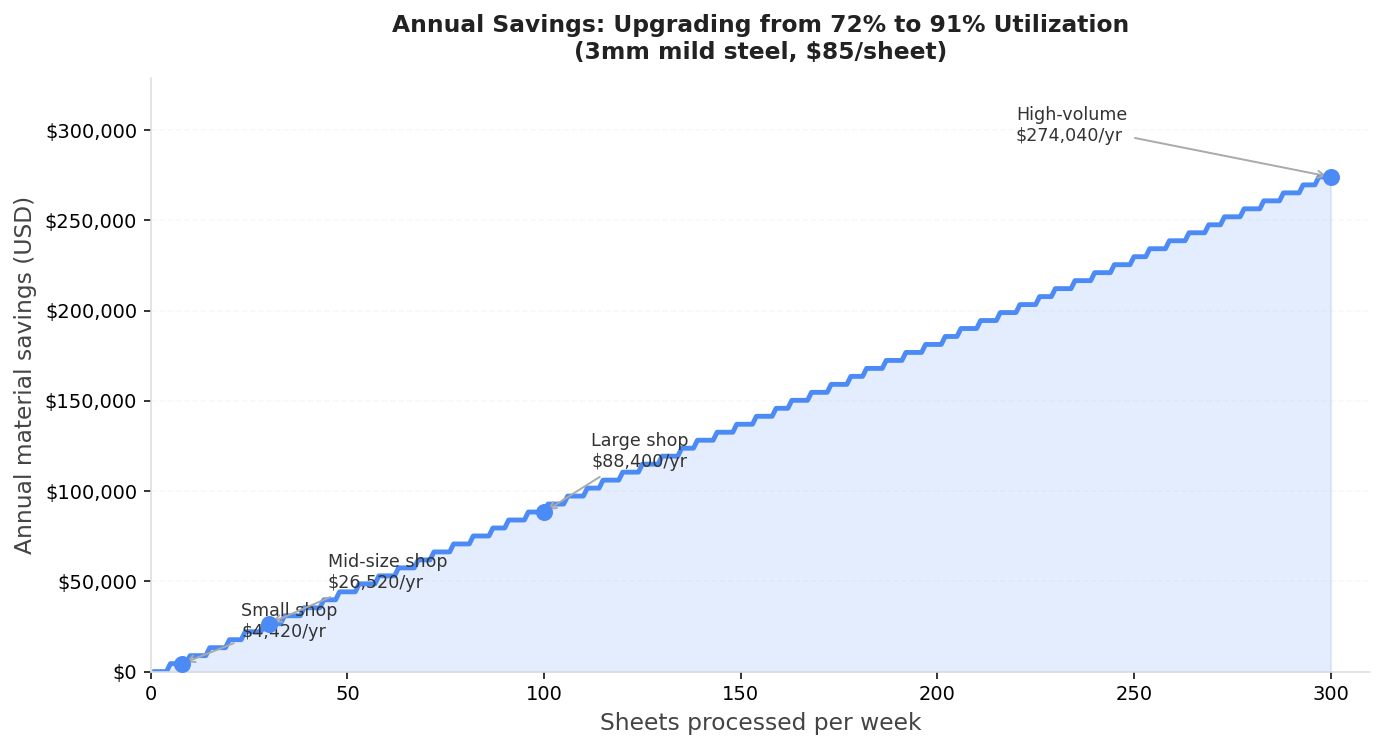
Calculated at $85/sheet (3mm mild steel, 1500×3000mm), comparing rectangular nesting at 72% to optimized true-shape nesting at 91%.
Why your rate might be lower than expected
If you’re running true-shape nesting software and still getting numbers in the 70s, one of these is usually responsible.
Rotation is disabled. If you’re restricting all parts to 0° or 90° only, the optimizer can’t interlock parts the way true-shape is designed to. Check whether your nesting software is actually allowing free rotation. A shop running grain-sensitive parts should lock only those parts, not the entire job.
Kerf setting is too large. A 3mm kerf on a job with 200 tightly-packed parts forces 3mm of clearance on every edge. That’s 6mm consumed per shared boundary. On thin-material laser jobs where actual kerf is 0.2mm, using a default 1mm kerf wastes real sheet area. Kerf compensation in nesting software explains how to measure your actual kerf and set it correctly.
Sheet size is mismatched to part size. If your largest parts span most of the sheet width, the algorithm has very little room to fill the boundary region efficiently. Edge and corner regions generate structural waste regardless of algorithm quality. Using a smaller sheet for small-parts jobs or a larger sheet for your biggest parts can improve boundary efficiency.
The algorithm isn’t running long enough. True-shape nesting is NP-hard. Algorithms improve their solution quality over time, not instantly. If your software is cutting off the optimization early (often the default), try increasing the iteration limit or computation time. A second minute of runtime can recover 2–5 percentage points on complex jobs.
You’re mixing incompatible materials on the same job. Operators sometimes have parts from different thicknesses or materials open in the same nesting job, forcing the optimizer to treat them as the same material. The algorithm will still pack them, but the resulting nest won’t be cuttable as a single run. This shows up as artificially low utilization on the report.
Diagnostic flowchart
Use this to identify what’s pulling your utilization down before changing settings:
flowchart TD
    A[Utilization below target] --> B{Is rotation enabled?}
    B -- No --> C[Enable rotation or increase allowed angles\nExpected gain: 5–10 pp]
    B -- Yes --> D{Is kerf set correctly?}
    D -- No / Unsure --> E[Measure kerf, set actual value\nSee kerf compensation guide]
    D -- Yes --> F{Are parts mostly rectangular?}
    F -- Yes --> G{Are parts cut in large batches?}
    G -- Yes --> H[Test common line cutting\nExpected gain: 3–5 pp on rect. jobs]
    G -- No --> I[Consider true-shape nesting\nor batch more parts per run]
    F -- No --> J{Are parts complex / irregular?}
    J -- Yes --> K[Verify true-shape mode is active\nnot rectangular bounding-box mode]
    K --> L{Is computation time limited?}
    L -- Yes --> M[Increase iteration count or time limit\nExpected gain: 2–5 pp]
    L -- No --> N[Check sheet size vs part size ratio\nMismatch causes boundary waste]
FAQ
What is considered a good material utilization rate for laser cutting?
For fiber laser cutting of mixed fabrication parts, 85–92% is the achievable range with true-shape nesting and rotation enabled. Rates above 92% typically require specific conditions: jobs with many identical parts, common line cutting enabled, or very high iteration counts. Rates below 80% on a laser job usually indicate a suboptimal nesting method, disabled rotation, or an oversized kerf setting.
What is considered a good utilization rate for plasma cutting?
Plasma cutting typically achieves slightly lower utilization than laser cutting because plasma kerf is larger (1.5–4mm vs 0.1–0.3mm for laser), and minimum part spacing requirements are higher due to heat-affected zone considerations. Expect 78–88% with good true-shape nesting software on mixed plasma jobs. On rectangular plasma jobs, common line cutting can push utilization above 90%.
How do I increase my material utilization rate?
The highest-impact actions in order: (1) switch from manual layout or rectangular nesting to true-shape nesting, (2) enable part rotation, (3) verify your kerf setting matches your actual measured kerf, (4) increase the optimizer’s computation time. Together these changes typically move a shop from the 60–70% range to 85–92%.
Does utilization rate vary by material type?
The algorithm doesn’t change with material, but the minimum spacing required does. Aluminum nesting often requires more spacing due to thermal sensitivity. Stainless requires careful heat management. Thick plate (>20mm) needs wider part spacing regardless of kerf width due to cutting head geometry. These spacing requirements reduce theoretical utilization. Achievable rates on thick plate plasma jobs are often 5–10 percentage points lower than on thin sheet laser jobs.
My nesting software shows 90%+ utilization but I’m still running out of material. What’s happening?
The utilization shown in nesting software refers to the nest layout only - the percentage of the sheet covered by parts in the plan. Actual yield depends on whether the nest translates cleanly to the cut run: missing parts, scrapped sheets from lead-in problems, or nested remnants that can’t be cut cleanly all reduce your real yield below the reported figure. If your software shows 90% but your production numbers don’t match, track sheets consumed per finished part over a month rather than relying on the software’s reported utilization. That gives you your actual manufacturing yield, which is what drives material cost.
Should I nest jobs from different customers together on the same sheet?
If the parts are the same material and thickness, yes - mixing jobs is one of the most reliable ways to improve real-world utilization, because each individual small job may not fill a sheet efficiently on its own, but combined they can. Most nesting software supports job-mixing with color-coding or labels so parts can be sorted after cutting. This is a practical advantage of browser-based nesting tools like Lapas, where you can add parts from multiple jobs into one nesting session without managing separate project files.